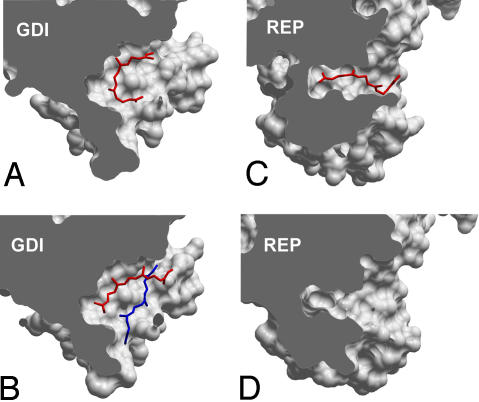
Fig. 3.
Comparison of lipid binding sites of GDI and REP molecules in complex with prenylated Rab GTPases. (A) Monoprenylated Ypt1:GDI complex (1UKV). (B) Diprenylated Ypt1:GDI complex (2BCG). (C) Monoprenylated Rab7:REP complex (1VG0). (D) Unprenylated Rab7Δ22:REP complex (1VG9). The complexes were optimally superimposed, and the domains II were sliced to expose the lipid-binding site. All molecular manipulations including generation of images were performed with ICM Browser Pro (Molsoft, Redmond, WA).

