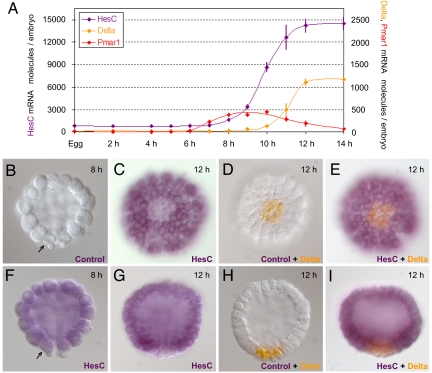
Fig. 3.
HesC temporal and spatial expression pattern. (A) Measurements of hesC mRNA molecules per embryo (purple) are compared with those of pmar1 (red) and delta (orange) at the indicated developmental time points. Error bars represent the standard deviation from three individual measurements on the same sample. (B–I) Images of embryos on which WMISH (B, C, F, and G) or double-WMISH (D, E, H, and I) was performed. The developmental stage of each embryo is indicated at the upper right corner. (B and F–I) Side views, with a vegetal side at the bottom. (C–E) Vegetal views. The arrows in B and F point at one of the two visible skeletogenic micromere cells. Probes used are indicated at the lower right corner. Control, probe used to control for nonspecific staining.

