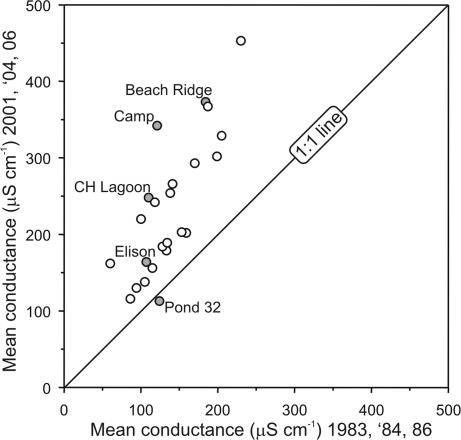
Fig. 3.
Comparison of specific conductance values (as a proxy for evaporation/ precipitation; E/P) for July 14 (or as close to that date as possible) from the 24 lower peninsula ponds on Cape Herschel, measured in the three earliest field seasons (1983, 1984, and 1986), compared with measurements for the last three field seasons (2001, 2004, and 2006). Each point represents one of the Cape Herschel study sites; filled circles represent sites mentioned in the text and only these sites are labeled. If a point falls on the 1:1 line, no change in average water conductance has occurred since the 1980s. If the site points are above the 1:1 line, specific conductance has increased since the 1980s. From this analysis, it is clear that all ponds have increased in conductance since the 1980s, except one site (Pond 32), which is the lowest elevation pond on the Cape and is still receiving snowmelt via several streams in July from the two plateaus. Larger and deeper sites, such as Elison Lake, show smaller changes, as expected.

