Fig. 1.
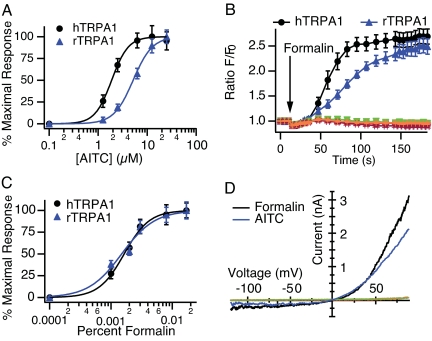
TRPA1 is activated by formalin. Fluo-4 Ca2+ responses of HEK-293 cells expressing human (black) or rat (blue) TRPA1. AITC- (A) or formalin- (C) induced concentration/response curves. Each point represents the average response of 49 experiments, ≈3 min after stimulation. (B) Representative experiment displaying full time course of the calcium response to formalin (0.01%). Parental cells (red) and cells expressing human TRPV1 (magenta), TRPV3 (orange), or TRPV4 (green) were unresponsive to formalin. (D) Representative current–voltage relationship of whole-cell currents evoked in TRPA1-expressing cells by formalin (0.01%; black) or AITC (5 μM; blue). Parental cells (red) and cells expressing human TRPV1 (magenta), TRPV3 (orange), or TRPV4 (green) were unresponsive. Currents were recorded in response to a 400-ms voltage ramp from −120 to +100 mV; n = 5 per agonist.

