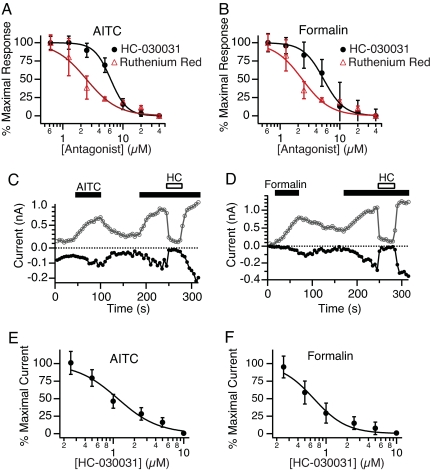
Fig. 2.
Block of TRPA1 by ruthenium red and HC-030031. (A and B) Concentration-dependent inhibition of calcium responses by HC-030031 (black) or ruthenium red (red) in hTRPA1 cells activated by AITC (A) or formalin (B). Each point represents the average response of 18 experiments, ≈3 min after stimulation. (C and D) Time course of inward (closed circles) and outward (open circles) currents recorded in the perforated patch configuration for single representative cells activated by AITC (5 μM; C) or formalin (0.01%; D) and blocked by addition of HC-030031 (10 μM, HC, open bar). (E and F) Concentration-dependent inhibition of AITC- (E) or formalin- (F) evoked currents by HC-030031 in hTRPA1 expressing cells. Each point represents the average of five independent cells; values represent mean ± SEM.

