
Figure 4.
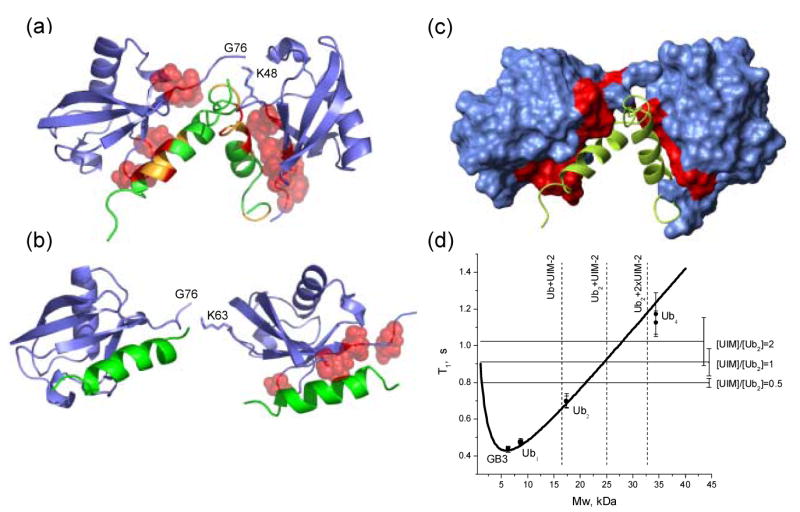
Models of two UIM-2 helices bound to (a) K48-linked Ub2 and (b) K63-linked Ub2. Side chains of Ub2 residues with Δδ > 0.2 ppm are represented by red spheres, while CSPs on UIM-2 (in panel (a)) are colored as follows: Δδ ≥ 0.4 ppm (red), 0.4 ppm > Δδ > 0.125 ppm (orange). These structures were obtained assuming that each UIM-2 binds to the corresponding Ub unit in the chain in the same way/orientation as to monoUb (PDB code 1YX6 8), and using the structures of K48-linked Ub2 in its complex with UBA2 (PDB: 1ZO6 22) and of free K63-linked Ub218 as structural models for the open conformation of the corresponding chain. The resulting structures were obtained by direct superimposition of ubiquitin atoms in the UIM:Ub complex with those for each Ub unit in Ub2. (c) The same complex as in panel (a), with Ub2 shown in surface representation, painted red for those sites on both Ub units that show significant CSPs and/or signal attenuations (see Fig.1). (d) NMR characterization of the stoichiometry of Ub2:S5a263–307 binding using 15N longitudinal relaxation rate measurements. The “molecular weight calibration” curve representing the molecular mass dependence of 15N T1 in proteins was calibrated as described in 22. The horizontal lines correspond to 15N T1 values measured in Ub2-P at various titration steps, as indicated (see also Table 1); the error bars represent standard deviations in T1 over core residues in Ub. The dashed vertical lines are “molecular weight markers” indicating the expected mass of the corresponding constructs.