
Fig. 2.
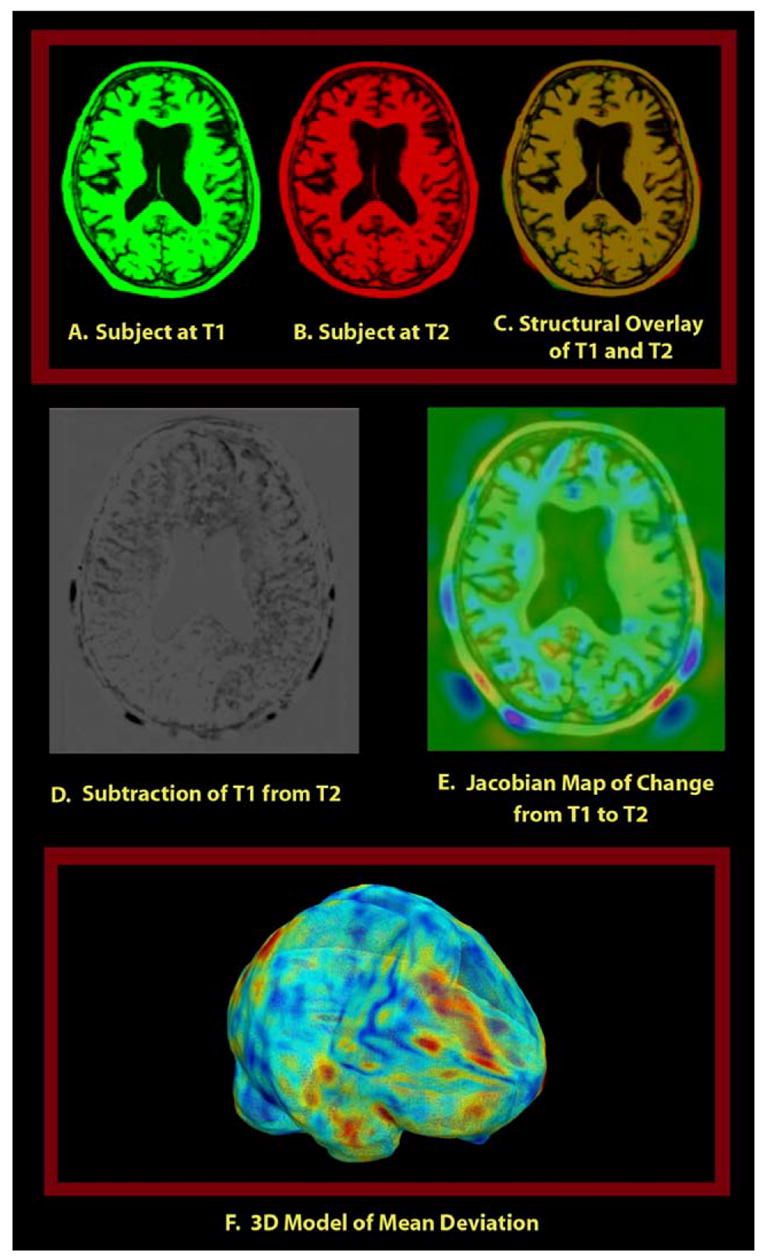
Illustration of the approach employed in this paper where a color map of the Jacobian determinant (a measure of expansion or compression of time) is generated by registering follow-up scan (source image) to baseline (target image) and computing the Jacobian of the forward mapping (baseline to follow-up). This map is overlaid on the baseline structural image to visualize voxelwise local tissue change. Red colors denote regions where local expansion is detected, blue colors denote compression, and green denotes regions with no detected change. Notice that the 3D local tissue change, encoded using the Jacobian map, could not be easily visualized by inspecting the subtraction map due to difficulties in reconstructing 3D spatial relationships from 2D slices.