
Fig. 5.
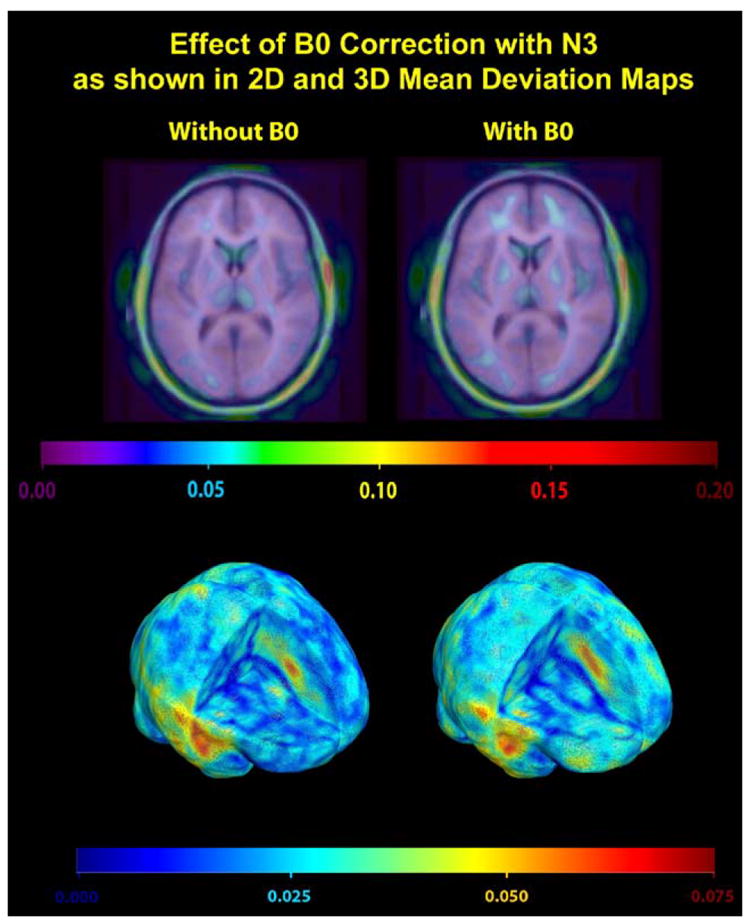
This figure visualizes the comparison of B0-corrected images (MEDIC) vs. GW and B1 intensity-corrected MP-RAGE images with N3 correction (N = 12 scans). A permutation test established no statistically significant differences between the two image types, although an effect may be detectable in a larger sample of scans. As in Fig. 4, the performance, coded here in color, is defined as the voxelwise absolute mean deviation from zero of the log-transformed Jacobian maps.