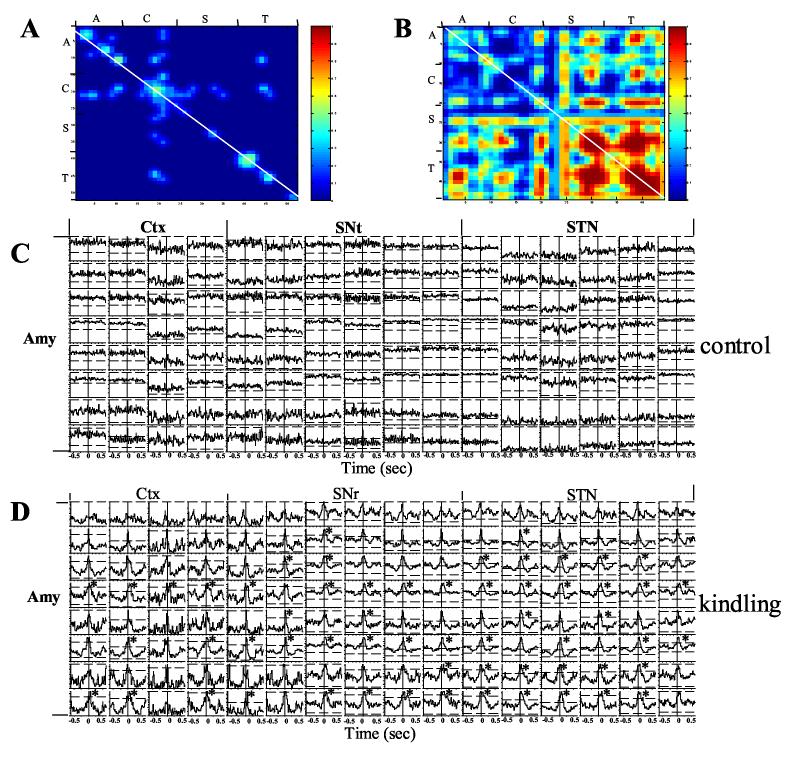
Figure 4.
Synchronized activity between simultaneously recorded neurons from the Amy, Ctx, STN and SNr before and during amygdala kindled seizures. A) Color coded significant cross-correlation level (99% confidence level shown as red) between neurons in different brain regions before amygdala kindling. Note that there was negligible cross-correlation between different neurons. B) During amygdala kindled seizures, massively synchronized firing appeared between neurons within the same and across different brain regions. The white diagonal line represents autocorrelation. C) Cross-correlogram analysis of synchronized activity between the neurons in the amygdala kindling site and other regions before amygdala kindling. Note that there was no obvious cross-correlation between the neurons. D) During amygdala kindled seizure, however, massive synchronization took place between neurons as demonstrated by peaks above 99% confidence lines. Many of the cross-correlations revealed a time lag of synchronized activity peaks. Note that most of the synchronized peaks lay on the plus side of crosscorrelogram plot, indicating a delay following spikes in the amygdala kindling site (indicated by * signs. A = amygdala, C = cortex, S = SNr and T = STN).

