
Figure 9.
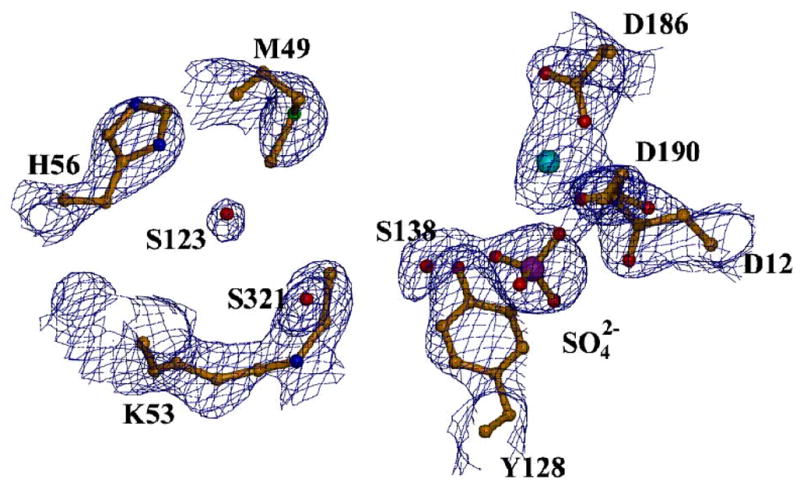
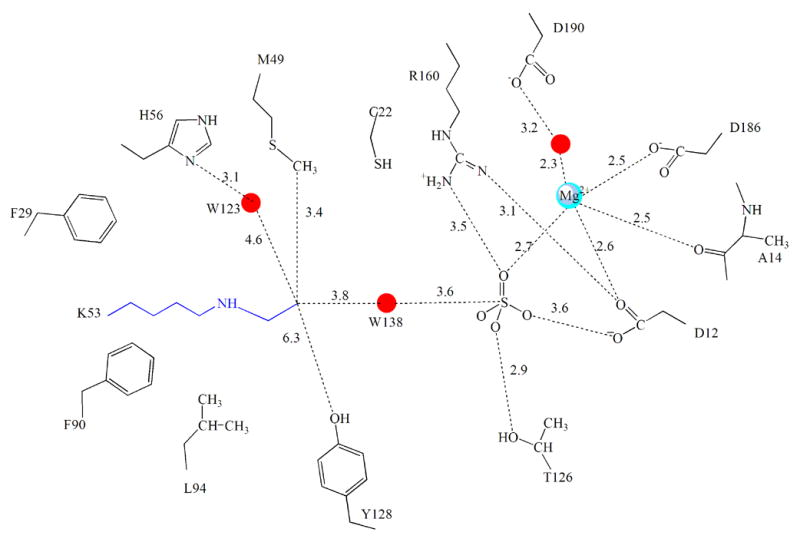
The active site of NaBH4 reduced phosphonatase. (A) Depicted with the electron density surrounding the modified Lys53. The active site residues (yellow) and ligands sulphate (orange) and cofactor Mg2+ (cyan) are depicted as ball-and -stick. The 2Fo-Fc electron density map (contoured at 1.5 σ) is shown as blue cages. (B). Chemdraw depiction of Ne-ethy-Lys53 and surrounding active-site residues (distances in Å).