
Figure 2.
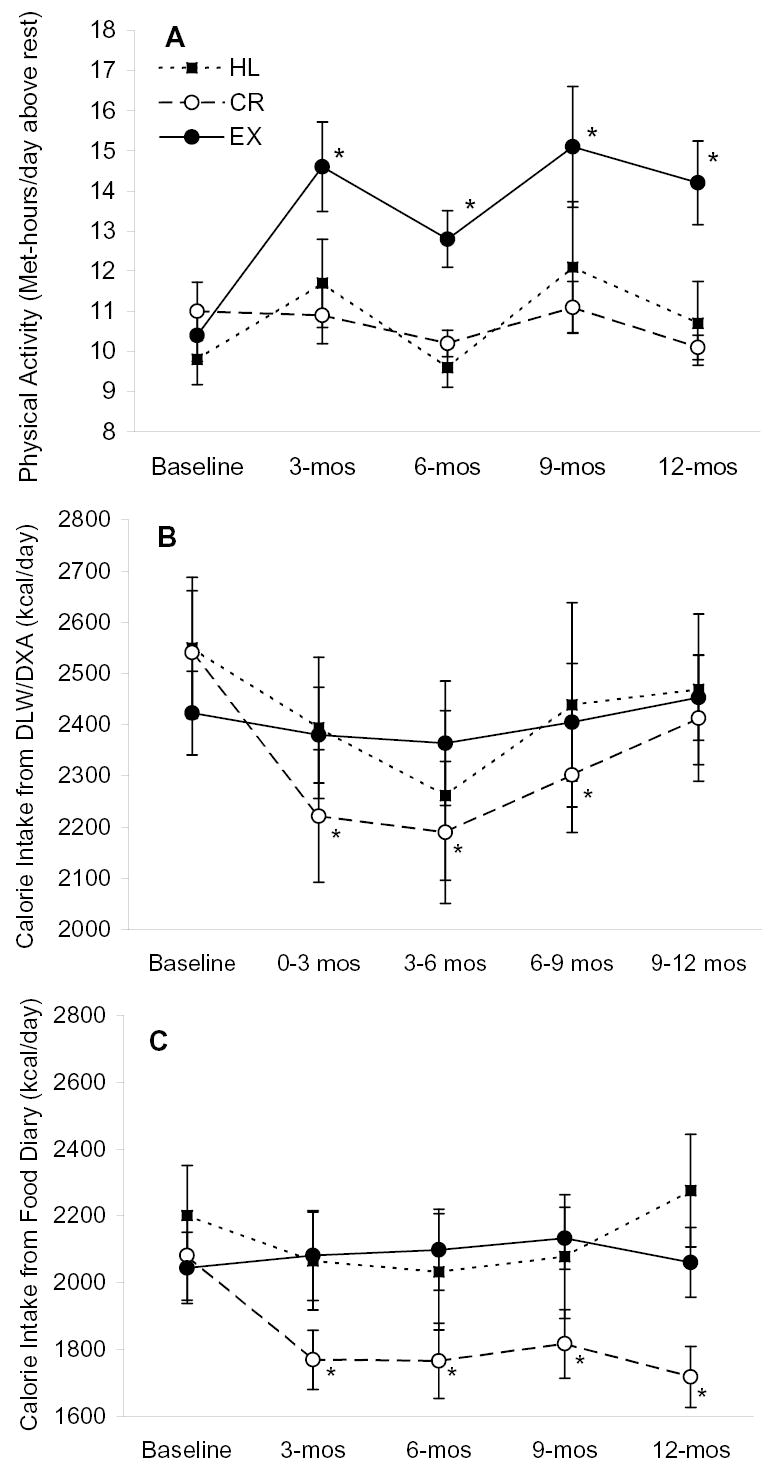
Physical activity and energy intake (mean ± SE) before and during the intervention. Panel A is physical activity level determined by physical activity recall questionnaire, Panel B is energy intake determined by DLW/DXA, and panel C is energy intake determined by food diary. Baseline values were not different among groups for any of the outcomes according to ANOVA. Interactions between study group and time were significant for data in panel A (p=0.0497), panel B (p = 0.01) and panel C (p=0.003) by repeated measures mixed-model ANOVAs that included baseline values as a covariate. * P ≤ 0.05 versus baseline within group by repeated measures, mixed-model ANOVA and Tukey tests. Sample sizes are 18, 18, and 10 for the EX, CR, and HL groups, respectively.