
Figure 3.
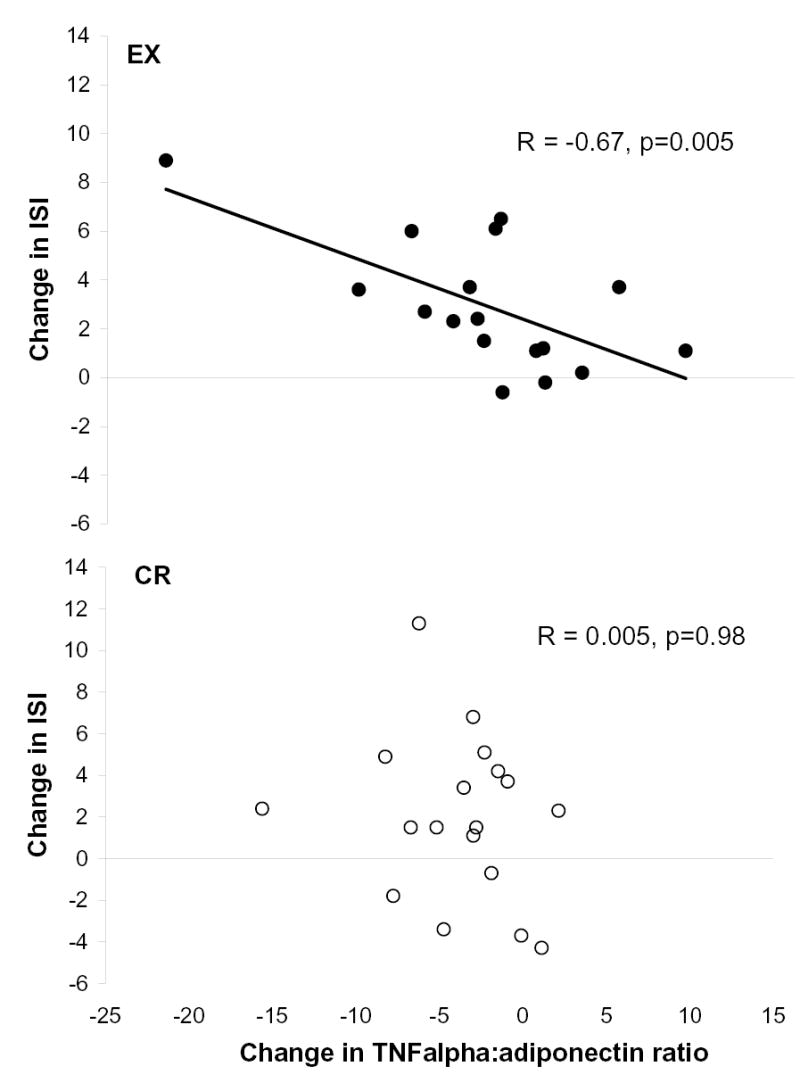
Relationships between changes in the TNFa to adiponectin ratio and the changes in insulin sensitivity index in the EX (n=17; excludes 1 subject due to technical problems during data collection) and CR (n=18) groups. Raw data were used for presentation; however, the associations were assessed using Pearson correlations after parsing out the effects of baseline ISI. The correlation in the EX group was significantly greater than that in the CR group (p=0.03) as determined using Fisher’s z transformation.