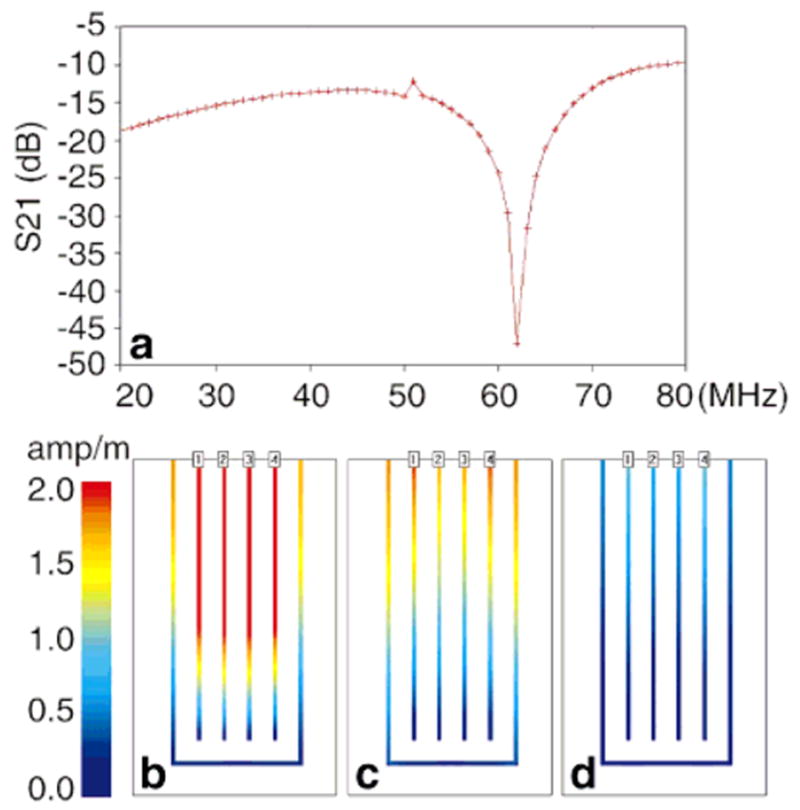
FIG. 6.

The results of the transmission line analysis of the PSA. a: The simulated S21 response. b: The current distribution at 64 MHz with a strip length of a quarter wavelength, λ/4. There is no distinction among the signals on the four strips, and the standing wave makes the amplitude of the signal high. c: The current distribution at 48MHz, wherein the strip length is 3λ/16. d: The current distribution at 32MHz, wherein the strip length is λ/8. In both c and d, the coupling causes the signals on the center two strips to differ from the signals at the ends. However, a low standing-wave ratio makes the amplitude of the signals much weaker than in a.
