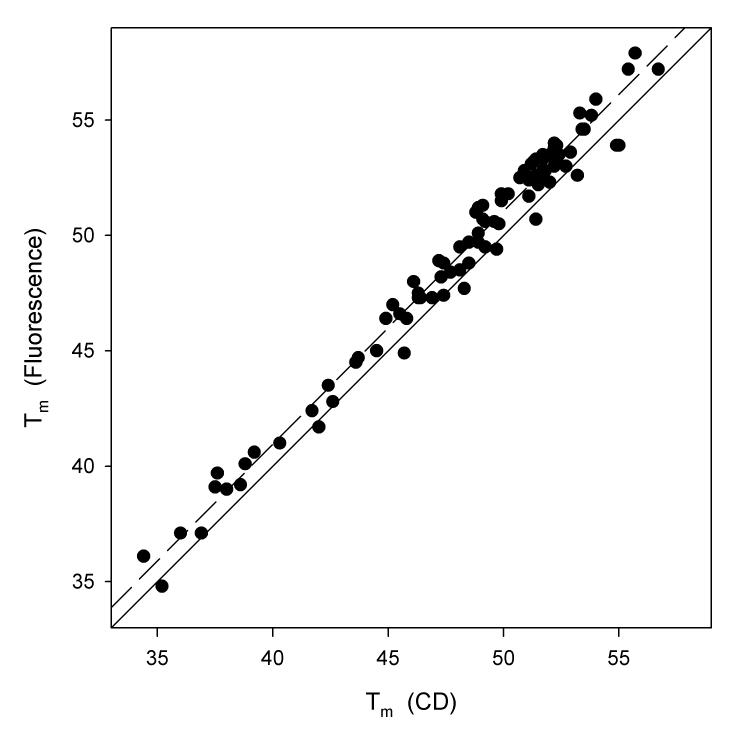
Figure 2.
Plot of midpoint temperature in units of °C calculated from fluorescence thermal denaturations as a function of midpoint temperature calculated from circular dichroism thermal denaturations. The solid line is that upon which all points would fall if there were perfect correspondence in the two values. The dashed line is the result of a least square fit. The slope of this regression line is 1.012, the Y-intercept is 0.463, and the value of r2 is 0.9787.

