
Figure 6.
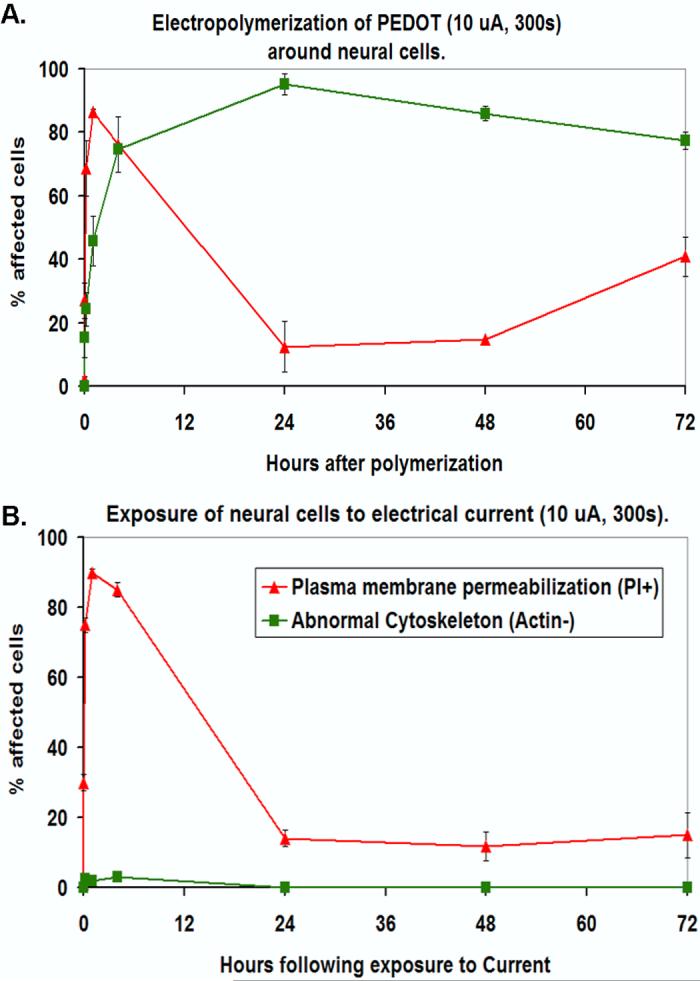

(A) Line graph showing timecourse of plasma membrane permeabilization as indicated by nuclear staining for the membrane impermeant dye, propidium iodide (red triangles; PI+) and actin cytoskeletal disruption as indicated by a loss of phalloidinstained F-actin stress fibers (green squares; Actin-) associated with electropolymerization of PEDOT around living neurons (MCC). The data are presented as percentage (%) of affected cells (either PI+ or Actin-) at 0h, 5min, 30 min, 1h, 4h, 24h, 48h, and 72h after polymerization-embedding in PEDOT. (B) Line graph showing % PI+ and Actin-cells following exposure to electrical current (no monomer present; control conditions). (C) Optical microscope image showing a thick film of PEDOT (dark substance) around MCC and partly covering their processes 30 min after polymerization. (D) PI staining (red fluorescence in nuclei) of cells embedded in PEDOT. (E) Merged image. (F) Optical image showing thin film of PEDOT around MCC 4h after polymerization. (G) Fluorescent microscope image of MCC stained with phalloidin-Oregon Green (green fluorescence) to detect F-actin. Inset shows the normal morphology of the F-actin cytoskeleton in control cells. (H) Merged image.