
Figure 4.
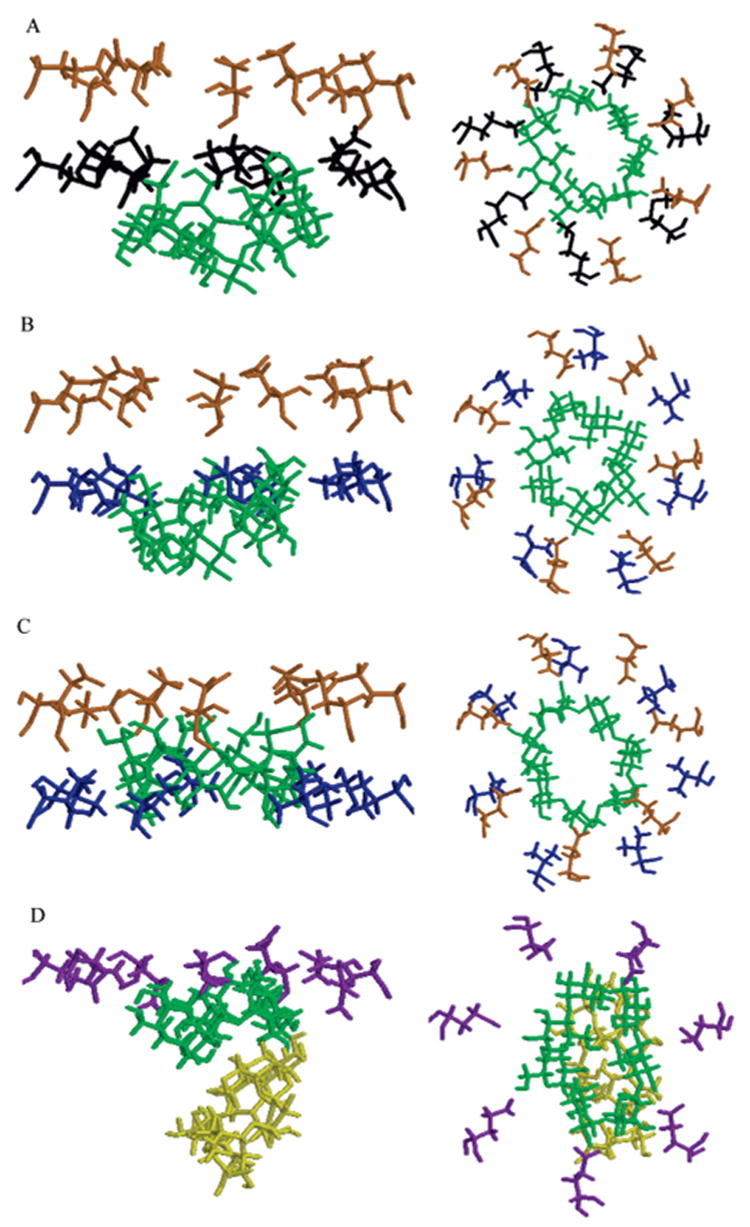
Fragments of the βCD–M113X complex structure from the MD simulations of the wild type (A), βCD–M113V mutated complex at the end of TI (B), and after further extensive equilibrium MD simulation (C); M113 is shown in black, V113 is shown in blue, E111 is shown in orange, and βCD is shown in green. The βCD–M113E mutated complex after TI and additional MD simulations (D); E113 is shown in purple; βCD after TI is shown in green, and βCD after further 1 ns MD simulation is shown in dark yellow. The rest of the protein, water molecules, and dummy atoms are not displayed. In the left panels, the z-axis is oriented as in Figure 1c; in the right panels, the z-axis is oriented normal to the paper toward the reader; that is, the top view of the channel from the cis side of the membrane (Figure 1a) is shown.