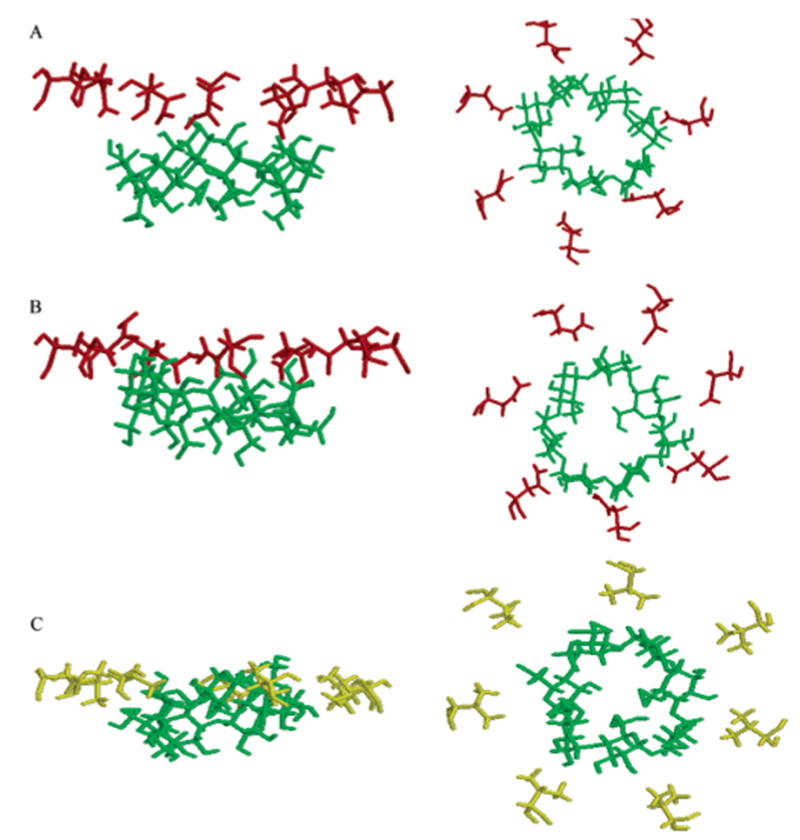
Figure 6.

Fragments of the βCD–M113N and βCD–M113A complexes: (A) initial position of the downward oriented βCD in βCD–M113N; (B) after the 2 ns equilibrium MD simulation of βCD–M113N; (C) after the 2 ns equilibrium MD simulation of βCD–M113A. The M113N residues (red), M113E (yellow), and βCD (green) are shown as the stick model. Protein, water molecules, and dummy atoms are not displayed. The z-axis scale is the same as that in Figure 1a,b.
