
FIGURE 2.
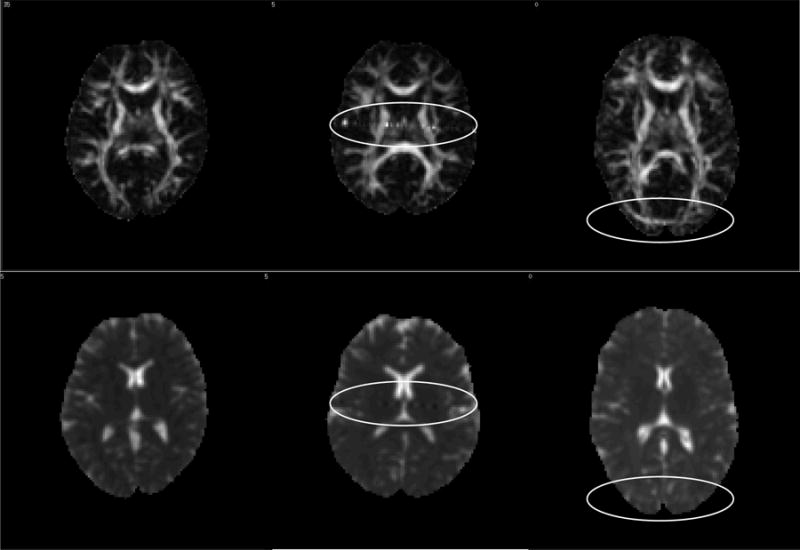
Representative FA and Trace images included in the study. Top row: FA images, bottom row: Trace images. Some artifacts are indicated by white ovals. From left to right: no artifacts (left panel), “zipper” artifact caused by noise generated by the gradients (center) and artifact caused by inadequate fat suppression (right).