
Figure 5.
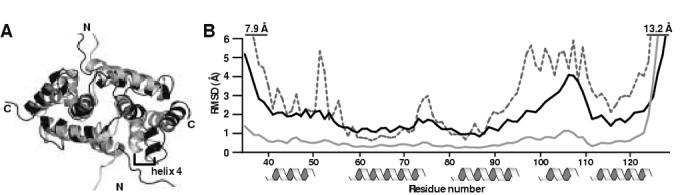
Comparison of MZF1 and ZNF174.
(a) Ribbon view of the superimposed representative conformers for MZF1 (PDB entry 2fi2) and ZNF174 (PDB entry 1y7q) aligned using the FATCAT server 21. MZF1 is shown in gray and ZNF174 is shown in black. (b) Global backbone atomic RMS deviations for MZF1 (solid gray line) and ZNF174 (solid black line) plotted as a function of residue number. Average Cα-Cα RMSD values were calculated for the representative conformer of MZF1 superimposed on the ZNF174 ensemble and plotted as a function of residue number (dashed line). Numbering corresponds to the MZF1 SCAN domain.