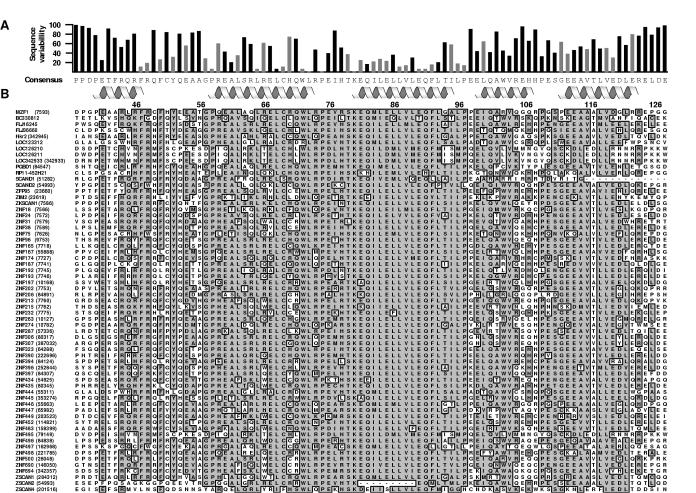
Figure 6.
Analysis of SCAN domain residue conservation.
(a) The consensus sequence and sequence variability was determined for each position and is shown above the alignment. Boundaries for helices 1-5 are denoted with helical icons and the gray bars represent residues contributing more than 5 Å2 to the dimer interface. Numbering corresponds to the MZF1 SCAN domain. (b) The 63 SCAN domain protein sequences were obtained from the NCBI database and aligned by Clustal W sequence alignment using MacVector 7.2, with an open gap penalty setting of 100.0. The Official Symbol and GeneID (in parantheses) assigned at NCBI are listed to the left of each corresponding amino acid sequence. The most common residues sharing >51% identity have been boxed and shaded in grey. Similar residues at these positions were shaded as well.

