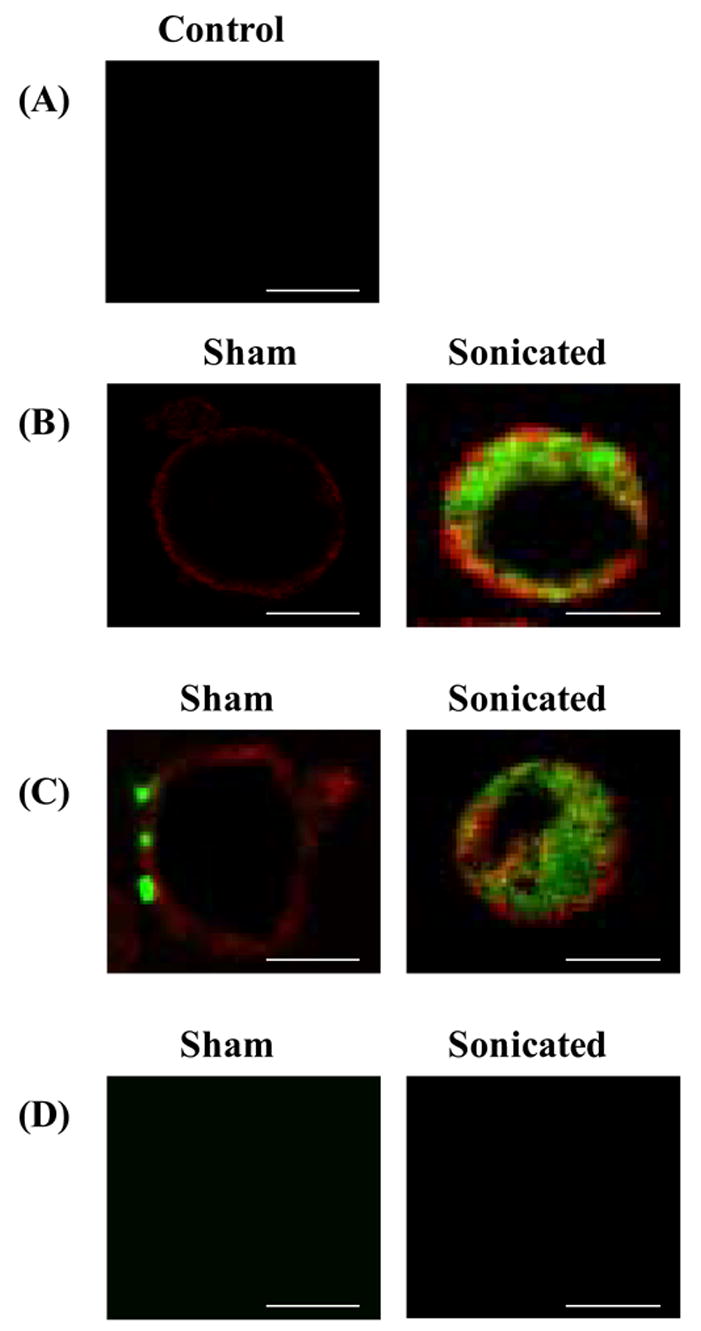
Figure 7.

Confocal microscopy imaging of the effect of ultrasound on intracellular uptake of PEI:DNA complexes at (A) A control cell with its membrane labeled with red-fluorescent wheat germ lectin exposed to ultrasound in the absence of PEI:DNA complexes. Cells labeled with ref-fluorescent wheat germ lectin and exposed to sham ultrasound (left) or ultrasound (right) in the prescence of green-fluorescent PEI:DNA complexes imaged at (B) 2 s, (C) 10 min and (D) 4 h after sonication. Scale bar = 10 μm.
