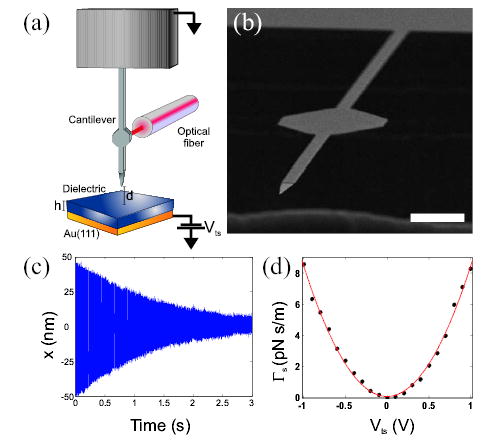
FIG. 1.

(a) Schematic of the experiment: d is the tip sample separation and h is the thickness of the polymer. The tip-sample voltage (Vts) is applied to the metal layer underlying the dielectric while the cantilever is grounded. (b) Scanning electron micrograph of a cantilever like the one used in this study. The hexagonal paddle on the shaft of the cantilever provides a target for the fiber optic interferometer. The scale bar is 10μm. (c) Total friction is measured by driving the cantilever at ωc abruptly turning off the drive signal and recording the ensuing decay to equilibrium shown here. (d) Sample induced friction (dots) for d = 15 nm as a function of the applied tip-sample voltage, with a quadratic fit (red line).
