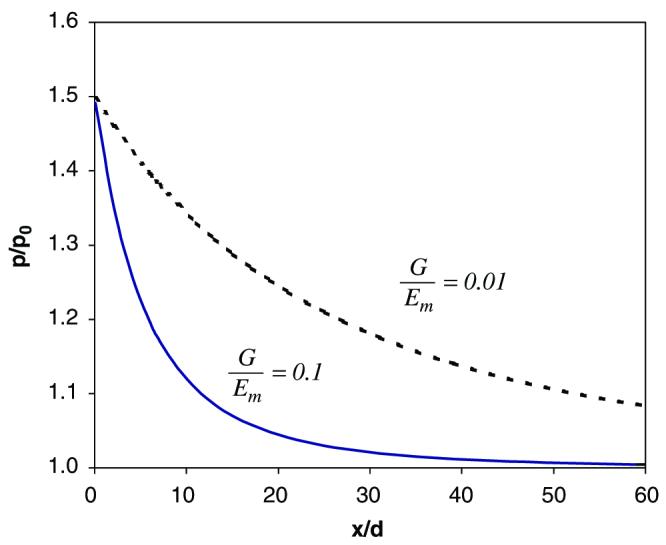
Fig. 5.

Stress concentration patterns in the mineral layer 2: (a) the linear (n → 1) and non-linear (n = 3) behaviors of the collagen phase used in the analysis; (b) effect of collagen non-linearity on the stress concentration pattern in the adjacent mineral layer to the initial crack. In the linear elastic case (n → 1), stress concentration occurs in a narrows region with respect to the original crack plane, whereas the stress concentration region is greatly expanded in the non-linear elastic case (n = 3). For ease of analysis, the following material and spatial properties of the mineral and collagen phases are employed: G = 1.0 GPa, Em = 100 GPa, h/d = 1.0, where G is the shear stiffness of the collagen phase, Em is the elastic modulus of the mineral phase, n is the collagen non-linearity factor, h and d are the thickness of the collagen and mineral phases, respectively.
