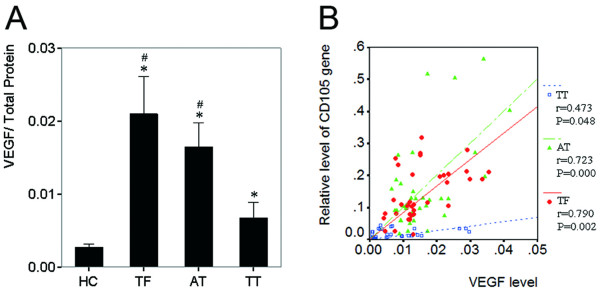
Figure 6.
Relative level of VEGF in normal, non-tumor (TF and AT), and tumor tissues and the correlation of VEGF and CD105. A, Relative level of VEGF in HC (n = 8), TF, AT, and TT (n = 36, * p < 0.05 versus HC; # p < 0.05 versus TT). Columns, mean; bars, SD. B, Correlation between VEGF and CD105 mRNA in TF, AT, and TT (n = 36).

