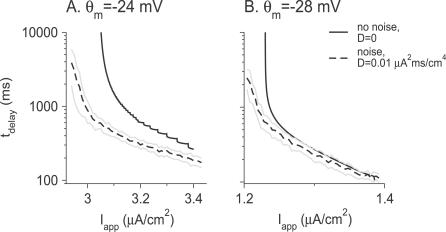
Figure 4. Dependence of the Delay Duration t delay on the Amplitude of the Current Step I app .
(A) θ m = −24 mV.
(B) θ m = −28 mV. In the two panels, g d = 0.39 mS/cm2. Solid lines: noiseless input (D = 0). Dashed lines: noisy input with variance D = 0.01 μA2 × ms/cm4. The delay duration was averaged over 50 trials. Gray lines represent one standard deviation around the mean value of t delay for noisy input.

