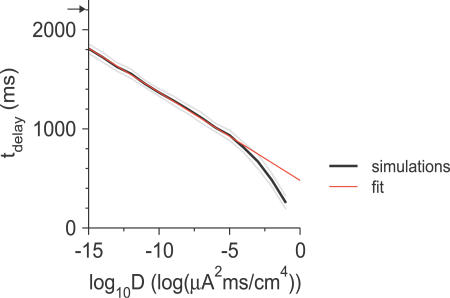
Figure 8. Dependence of the Averaged Delay Duration on the Noise Variance, D .
Black line: the delay duration, t delay, computed and averaged over 50 trials of the noisy external current step is plotted as a function of log(D). Parameters: θ m = −24 mV (small window Na+ current), g d = 0.39 mS/cm2, and I app = 3.08 μA/cm2. Gray lines: one standard deviation confidence limit of the averaged t delay. Red line: fitting to the simulation results using the analytical prediction for small D (Equation 4). The arrow on the y-axis indicates the value of t delay for a noiseless input (D = 0).

