Figure 2.

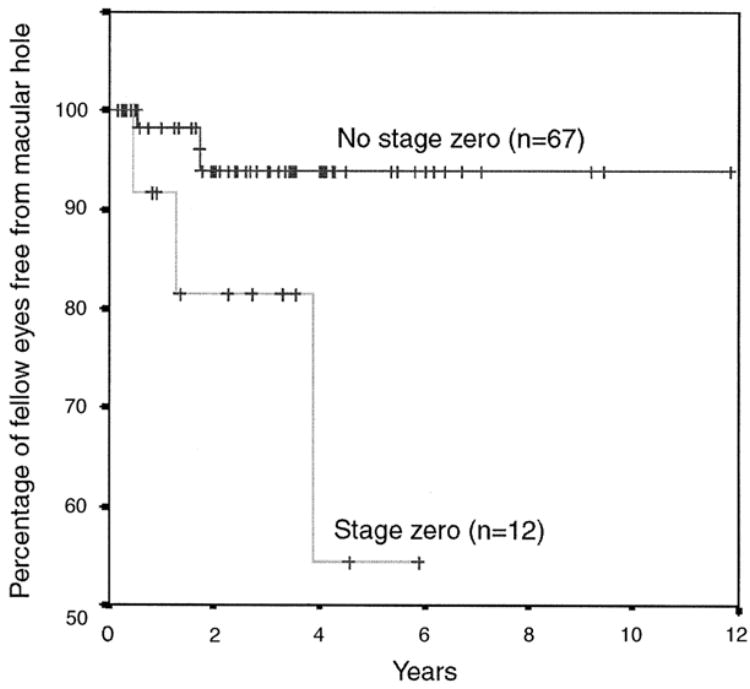
Kaplan–Meier survival curve. A comparison of the proportion free from a macular hole in biomicroscopically normal fellow eyes between patients with a stage 0 macular hole and those without.

Kaplan–Meier survival curve. A comparison of the proportion free from a macular hole in biomicroscopically normal fellow eyes between patients with a stage 0 macular hole and those without.