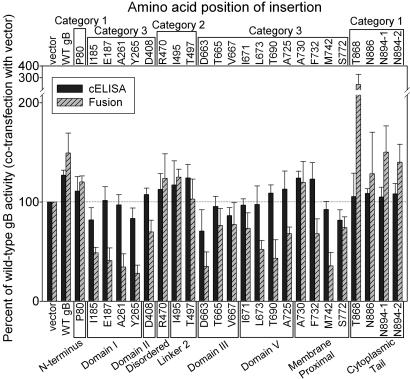
Fig. 3.
Effects of gB insertion mutants on cell surface expression and cell fusion activity of WT gB. The CELISA and cell fusion assays were performed as described in Fig. 2 except that the transfection mixtures for each sample of effecter cells contained an additional 30 ng of plasmid expressing WT gB. Positions of the mutations with respect to structural domains are indicated across the bottom. Categorization of the mutants with respect to phenotype is indicated across the top. The results are expressed as percentage of WT gB activity (1× dose of gB plasmid mixed with added empty vector).

