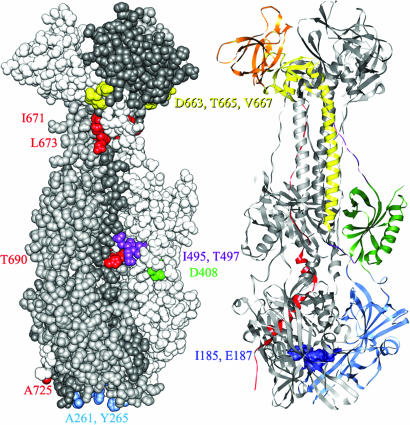
Fig. 4.
Mapping of insertion mutations on the structure of gB. (Left) Space-filling model with each protomer colored a different shade of gray. The amino acids bounding each insertion site are colored according to the domain or region to which each maps, using the color code shown in Fig. 1. Insertion sites in all three protomers are colored so that all surface insertion sites can be seen in one view. (Right) Ribbon model with the domains and regions of one protomer colored according to the code in Fig. 1. The insertion sites into the cavity of the trimer are indicated by dark blue coloring of the residues displayed in space-filling mode.

