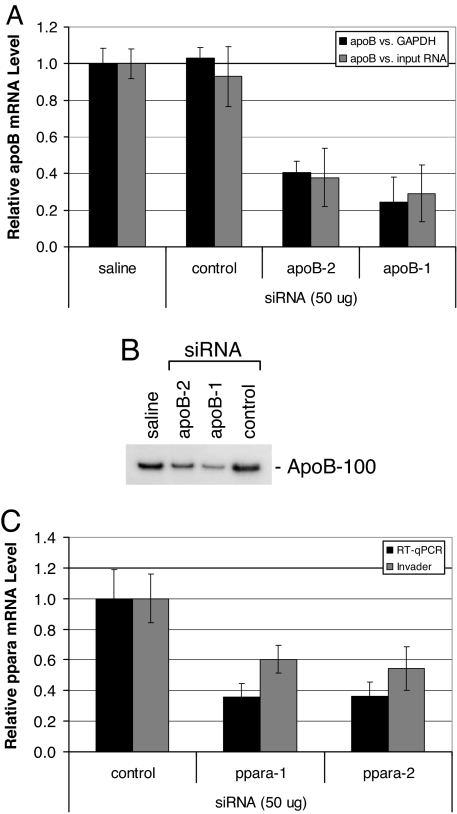
Fig. 4.
Knockdown of target gene expression in livers of mice after i.v. injection of siRNA polyconjugates. (A) Reduction of apoB mRNA levels in liver after treatment with apoB siRNA polyconjugates. RT-qPCR analyses of liver apoB levels relative to GAPDH mRNA or total input RNA were performed 2 days after injection of apoB-1, apoB-2, or control siRNA polyconjugate (800 μg of polymer, 50 μg of siRNA). Shown are the data normalized to mice receiving saline alone. n = 5, data are shown as mean ± SD. (B) Serum levels of apoB-100 protein are reduced in apoB siRNA polyconjugate-treated mice 2 days after injection. An equal volume of serum from individual mice was pooled for each group (n = 5) and subjected to Western blot analysis. (C) Reduction of ppara mRNA levels in liver after i.v. injection of ppara siRNA polyconjugates. RT-qPCR and Invader analyses of liver ppara mRNA levels relative to GAPDH or ubiquitin mRNA, respectively, 2 days after injection of ppara-1, ppara-2, or control siRNA polyconjugate (800 μg of polymer, 50 μg of siRNA). Shown are the data normalized to mice receiving saline alone. n = 5, data are shown as mean ± SD.

