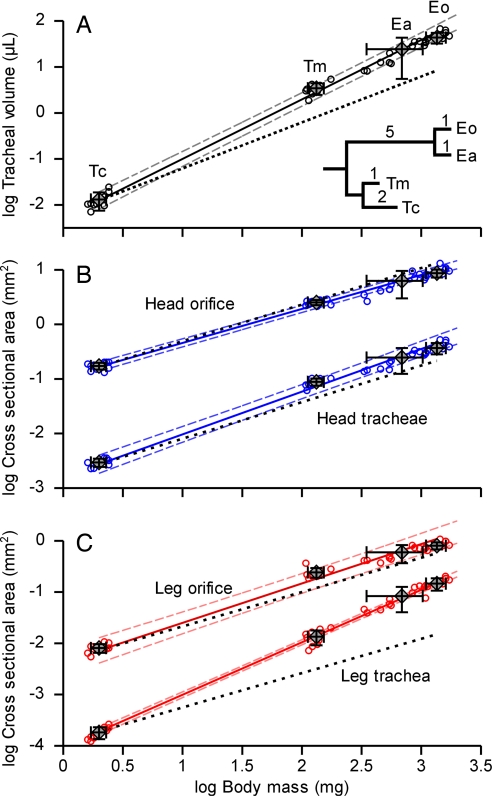
Fig. 3.
Scaling of tracheal and exoskeletal structures of four tenebrionid beetle species with body mass. Regression lines (solid lines) were fitted to species mean values (n = 4; diamonds, mean ± standard deviation) with the SMA method (22) on PICs (23). Large error bars of E. armata (Ea) are due to the large mass range of the measured individuals (ref. 22: “equation error”); the actual systematic errors are minimal. Individual values (open circles) demonstrate intraspecific scaling that follows interspecific trends. The phylogenetic tree shows hypothesized relationship between species. Branch lengths indicate estimated evolutionary divergence of species (figure 49 of ref. 24; ref. 25). See Materials and Methods for details. Eo, E. obscura; Tm, T. molitor; Tc, T. castaneum. Thin dashed lines indicate 95% confidence limits. Black dotted lines indicate isometric slopes. In the whole body and leg, but not the head, beetles devoted a statistically significant increasing fraction of their body to tracheae as they increase in size (see Table 1 for details).

