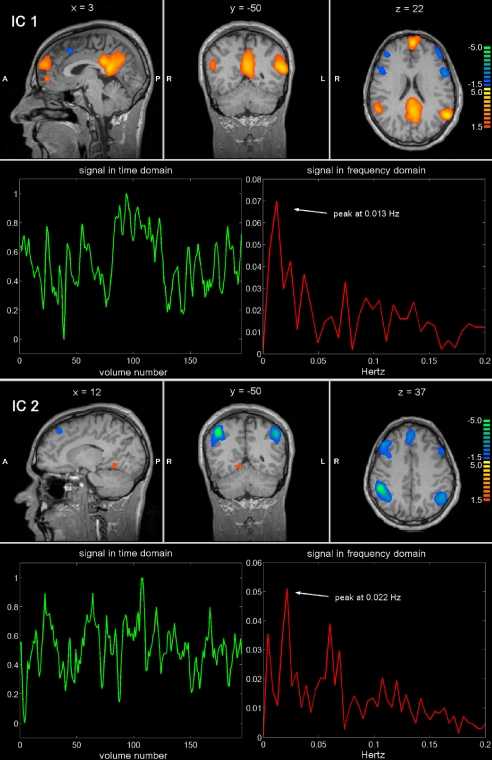
Fig. 1.
Example of two ICs separated by ICA from a single-subject fMRI data set. Sagittal, coronal and axial functional maps, are shown, along with the related BOLD signal in time and frequency domains. Brain areas are respectively colored in yellow-orange or in azure-blue in case of positive and negative correlation with the IC waveform.

