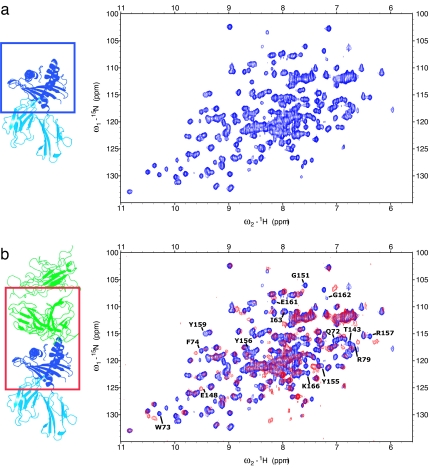
Fig. 1.
800 MHz 1H-15N HSQC spectra collected on the platform MHC. (a) Free MHC. (b) Superposition of the free MHC (blue) and its complex with 2C TCR (red). Only the region of the MHC highlighted in the box is present in our NMR sample; the TCR and peptide are not isotopically labeled and not visible in the spectra. Some of the peaks that shift upon complex formation are highlighted.

