Fig. 4.
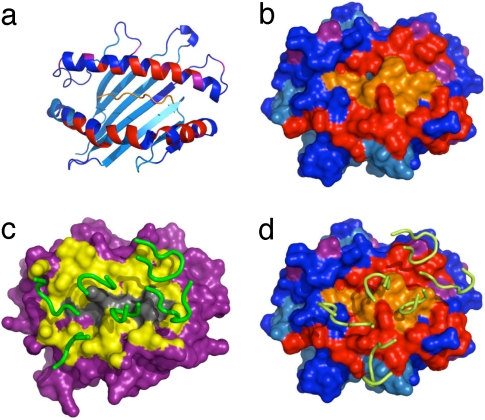
Residues that shift upon complex formation mapped on crystal structure. Residues with ambiguous or missing assignments are shown in cyan, residues with significant shift are shown in red, and residues with a small shift are shown in purple; the unlabelled peptide, for which we have no information, is shown in orange. (a) Cartoon representation of the H–2Ld–peptide structure with NMR shifts colored. (b) Surface representation of H–2Ld–peptide with NMR shifts colored. (c) Surface representation of the x-ray structure of the 2C–H–2Kb–dEV8 complex (16); the CDR loops are shown in green and residues within 6 Å of the MHC–TCR interface expected to shift in a mapping experiment are in yellow. (d) Surface representation of the x-ray structure of the 2C–H–2Ld–QL9 complex (17). The 2C CDR loops are shown in yellow, and residues are colored to indicate shift mapping result as in b.

