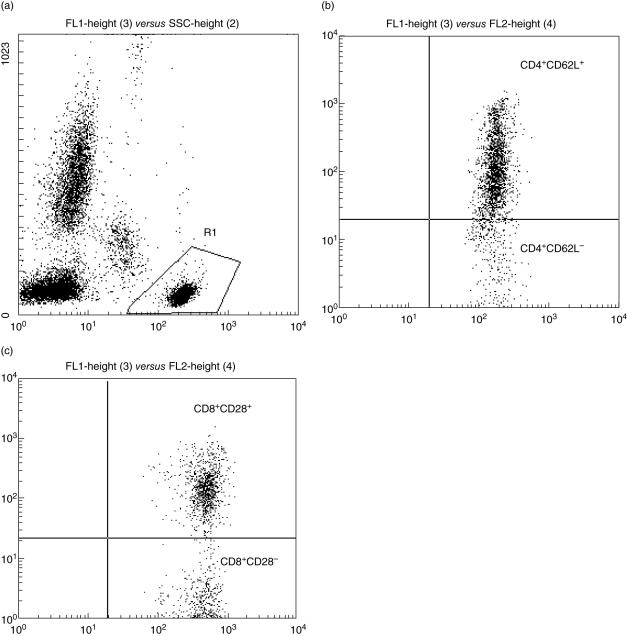
Fig. 1.
(a) The lymphocyte gate set in the FL-1-side-scatter distribution (R1) gate was selected to restrict the analysis of CD4 and CD8 positive cells. (b) CD4 positive effector T cells showing CD62L positive (upper right quadrant) and negative (lower right quadrant) phenotypes. (c) CD 28 positive T cells expressing CD28 antigen (upper right quadrant).

