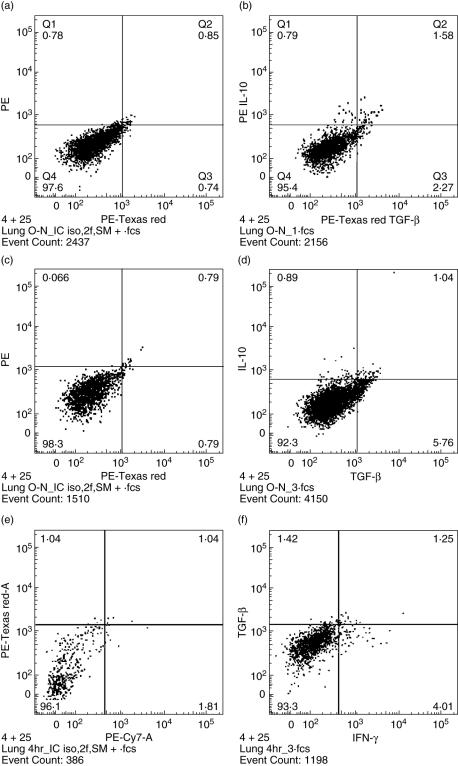
Fig. 1.
Representative flow cytometry dot plots of intracellular transforming growth factor (TGF)-β, interleukin (IL)-10 and interferon (IFN)-γ cytokine staining in lung CD4+ CD25+ lymphocytes stimulated in vitro with anti-CD3 and anti-CD28 antibodies. (a) Isotype controls; (b) representative day 21 sample (18-h stimulation) with 2·37% IL-10+ cells and 3·85% TGF-β+ cells, both above the respective isotype antibody controls. (c) Isotype controls; (d) representative day 28 sample (18-h stimulation) with 1·93% IL-10+ cells and 6·80% TGF-β+ cells, both above the respective isotype controls. (e) Isotype controls; (f) representative day 28 sample (4-h stimulation) with 5·26% IFN-γ+ cells, exceeding the respective isotype control.

