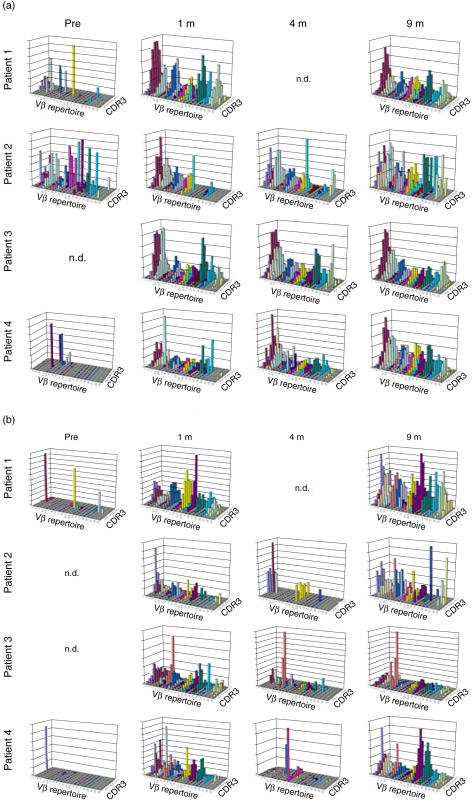
Fig. 4.
Simultaneous combined display of T cell receptor (TCR) Vβ repertoire distribution and CDR3 size distribution. Data from qualitative analysis (CDR3 sizes) and quantitative analysis (TCR Vβ repertoires) are displayed visually as graphic landscape columns for CD4+ T cells (a) and CD8+ T cells (b). Identical Vβ repertoires are shown in the same colour. Values on the vertical axis are relative and do not represent absolute numbers; n.d.: not determined.

