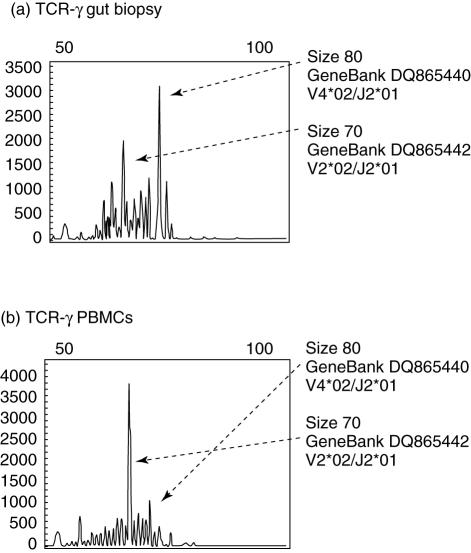
Fig. 1.
Comparison of the fluorescence-labelled T cell receptor–polymerase chain reaction (TCR–PCR) products by GeneScan analysis. The x-axes represent molecular size (base pairs) and the y-axes fluorescence intensity. (a) Duodenal tissue; (b) peripheral blood mononuclear cells of patient 1. In the duodenal sample PCR results show two overexpanded TCR-γ clones, while in peripheral blood mononuclear cells a single TCR-γ clone was found. Base pair size, NCBI GeneBank accession number and the corresponding V, D, J germline segments are reported next to the corresponding TCR-γ clonal peaks.

