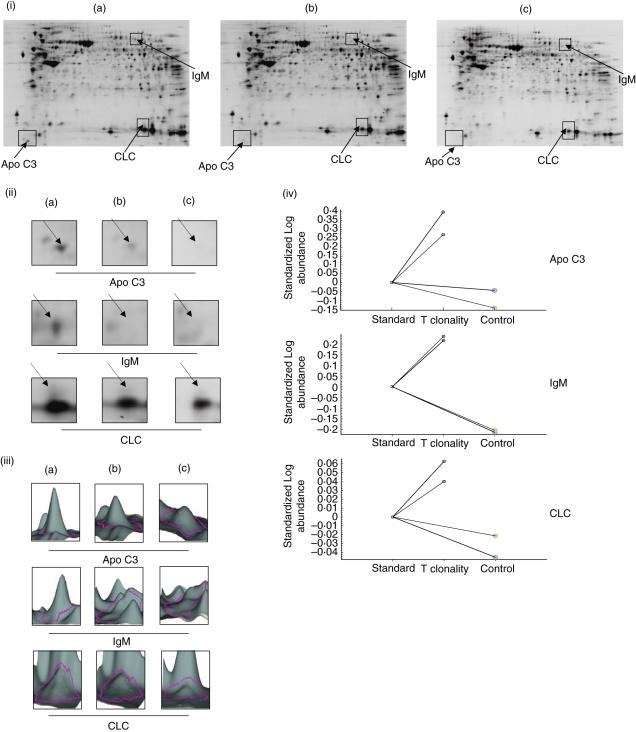
Fig. 2.
Two-dimensional (2D) difference gel electrophoresis between refractory type II CD (RCD-II) and controls. (i) 2D pattern from gut biopsy of (a) an RCD-II patient; (b) coeliac disease (CD) patients and (c) patients with no DQ2/8 variants. Proteins were separated on the basis of pI (x-axis) and molecular mass (y-axis). Highlighted in rectangles are those areas where consistent alterations of protein expression were identified. (ii) Enlarged portions and (iii) 3D view of regions highlighted in (i). Each protein was identified by matrix-assisted laser desorption ionization time-of-flight mass spectrometry (MALDI-TOF MS), and shown as abbreviations on the gels. (iv) Graphical representation of the intergel distribution of apo C3, IgM and Charcot–Leyden crystal protein (CLC) expression levels in RCD-II patient and in CD and normal patients determined with bva version 6·5 software.

