Fig. 2.
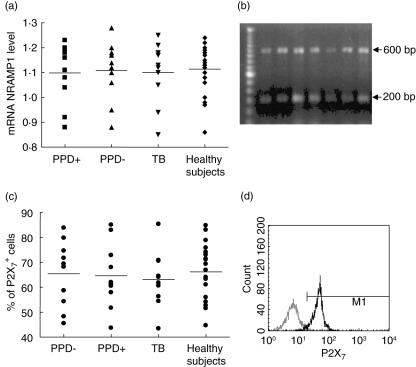
Expression of P2X7 and NRAMP1 genes in mononuclear cells (MNC) from patients with pulmonary tuberculosis and healthy contacts. (a) The expression of NRAMP1 gene at mRNA level was analysed by reverse transcription–polymerase chain reaction (RT–PCR) and results were normalized to β-actin mRNA level, as stated in Materials and methods. Horizontal bars correspond to the arithmetic mean values of each group. No significant differences among the four groups studied were detected. (b) Representative results of NRAMP-1 mRNA expression in three patients with tuberculosis (lanes 2–4) and four healthy contacts (lanes 5–8). The 600 base pairs (bp) bands correspond to NRAMP1 and the 200 bp bands to β-actin. (c) Analysis of expression of P2X7. Peripheral blood mononuclear cells (PBMC) were immunostained for P2X7 and then analysed by flow cytometry. No significant differences were found among the four groups studied. Horizontal bars correspond to the arithmetic mean values of each group. (d) A representative histogram of P2X7 expression in PBMC from a patient with tuberculosis is shown. The thin line histogram corresponds to the negative control, and the thick line histogram to cells stained with a specific antibody to P2X7.

