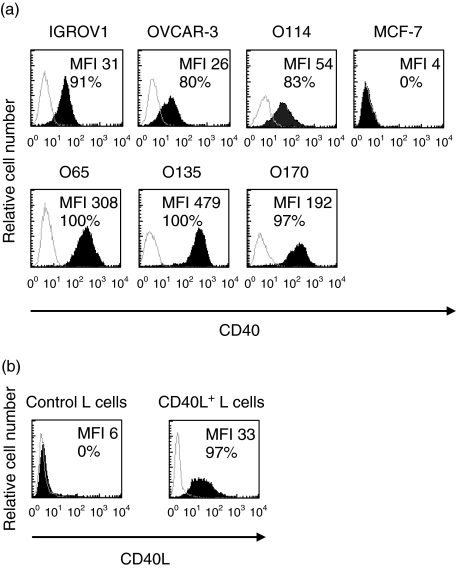
Fig. 1.
Expression level of CD40 by ovarian carcinoma (OVCA) cell lines and CD40L by transfected L cells. Cell surface expression of CD40 on human tumour cells [i.e. OVCA and breast carcinoma cell line (MCF-7) cells] and CD40L on L cells were studied separately using anti-CD40 (a) or anti-CD40L monoclonal antibodies (mAbs) (b) (filled curve). Background staining is indicated (open curve). Results are expressed in histogram form as the number of cells by channel of fluorescence intensity. Median fluorescence intensity (MFI) is indicated in each histogram as well as the proportions of cells expressing the cell surface marker.

