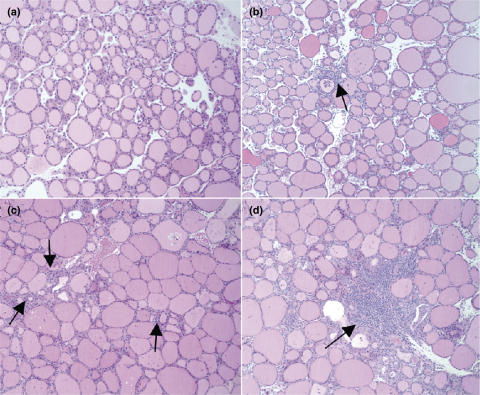
Fig. 4.
Histological appearance of EAT elicited by NT/DC. On d1 and d15, CBA/J mice were i.p. challenged with 2 × 10⁶ indicated NT/DC. Two weeks after boosting, the mice were sacrificed and the thyroid glands were removed for EAT assessment. (a) Normal gland, I.I. = 0; (b) Interstitial accumulation of inflammatory cells (arrows), I.I. = 1; (c) One or two foci of inflammatory cells (arrows), I.I. = 2; (d) Diffuse infiltration, 10–40% of total area (arrows), I.I. = 3. Magnification: ×100.

