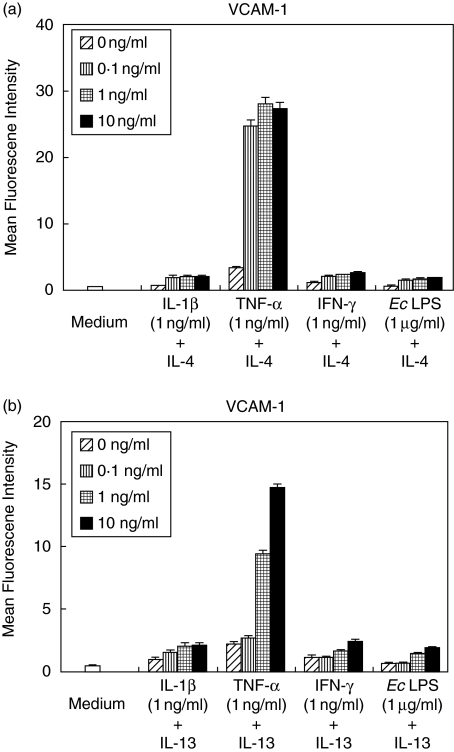
Fig. 2.
IL-4 and IL-13 synergizes with TNF-α for VCAM-1. Cells were stimulated with IL-1 β (1 ng/ml), TNF-α (1 ng/ml), IFN-γ (1 ng/ml) or E.coli LPS (1 µg/ml) and 0, 0·1, 1 or 10 ng/ml of (a) IL-4 or (b) IL-13 for 24 h. Cell surface VCAM-1 expression was analysed by flow cytometry. These results express percentage of positively stained cells. Data are presented as the mean ± SD of three experiments. *P < 0·05 (compared with medium-only control).

