Fig. 4.
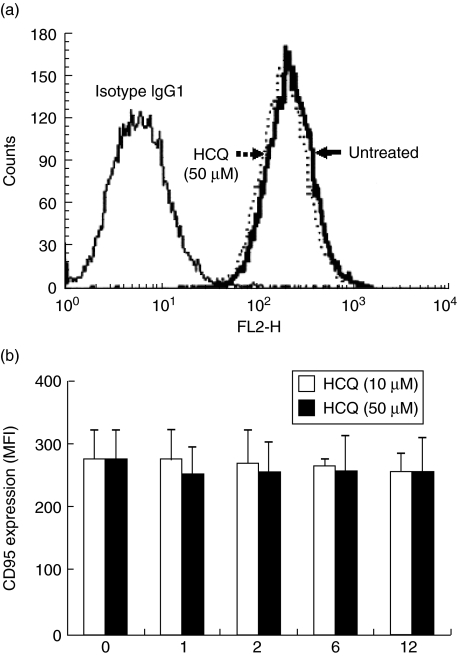
Flow cytometry analysis of Fas expression on synovial fibroblasts. The cells were treated with 10 and 50 µM of hydroxychloroquine (HCQ), and stained with phycoerythrin (PE)-conjugated mouse anti-human Fas (CD95). PE-conjugated mouse IgG1 was used as an isotype control antibody. (a) A representative result from three independent experiments using different cells is shown. The dotted line indicates Fas expression on fibroblast-like synoviocytes (FLS) treated with 50 µM of HCQ for 12 h, and a thick solid line on the left shows the constitutive Fas expression on the untreated cells. The thin solid line on the right indicates the cells stained with the isotype control IgG1. (b) Mean fluorescence intensity (MFI) of Fas expression on the cells treated with 10 or 50 µM of HCQ for a different culture period. Data are presented as the mean ± s.d. of three independent experiments.

