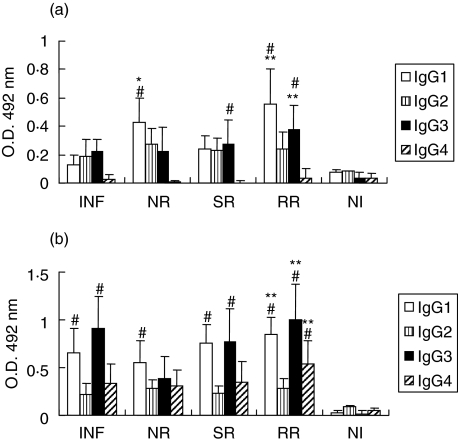
Fig. 6.
Analysis of IgG subclass responses to rSm29 (A) or SWAP (B). IgG subclass levels in sera of infected patients (INF), natural resistant individuals (NR), susceptible to reinfection individuals (SR), resistant to reinfection individuals (RR) and noninfected individuals (NI) were determined. Results are expressed as means of individual measurements. Error bars indicate SD of the means. #Statistically significant compared to the noninfected group (NI). *Statistically significant compared to the infected group (I). **Statistically significant compared to the susceptible to reinfection group (SR).

