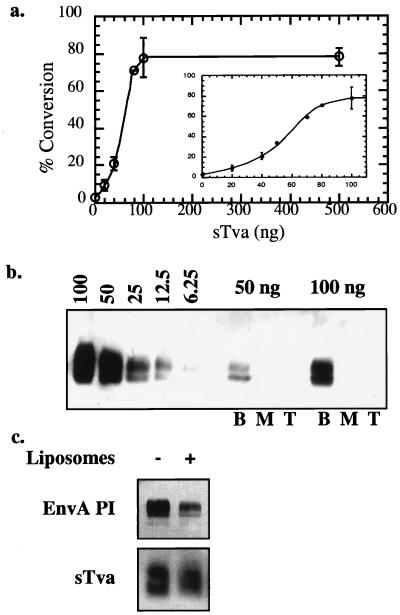
Figure 4.
EnvA PI–liposome association is nonlinear with respect to sTva concentration. Liposome-binding assays were performed with constant amounts of EnvA PI and increasing amounts of purified sTva, and then processed as described in Fig. 2a. (a) The percentage of EnvA PI converted to a membrane-binding form as a function of sTva concentration. (Inset) Titration curve between 0 and 100 ng of sTva. The mean and standard deviation of three experiments (open circle) were plotted by using kaliograph software (Abelbeck Software). Data points at 50 and 70 ng represent single experiments. (b) Liposome-binding assays were performed with subsaturating (50 ng) and saturating (100 ng) amounts of sTva. Fractions were analyzed by SDS/PAGE and Western blotting using anti-Tva antibodies and were compared with sTva mass standards. (c) EnvA PI was incubated with 100 ng of sTva for 15 min at 4°C. Liposomes in PBS (+) or PBS alone (−) were added, and samples were shifted to 37°C for 15 min. Precipitation of sTva with bound EnvA PI was analyzed by SDS/PAGE and Western blotting with antibodies specific for Tva and EnvA.

