
Fig. 1.
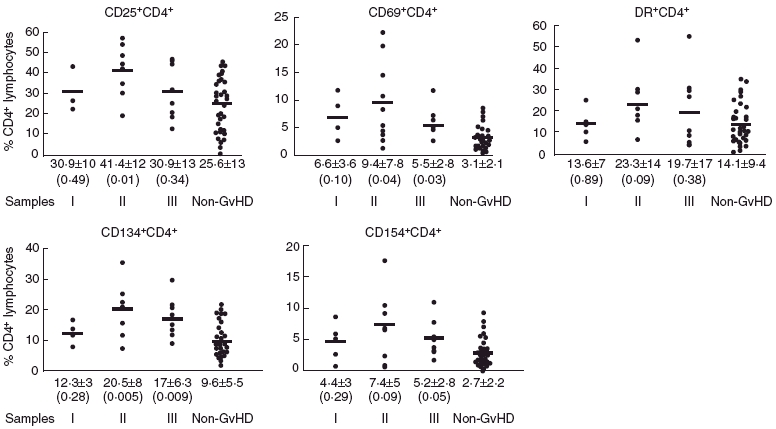
Phenotypic distribution of CD4+ cells from 105 samples of 24 patients. Samples were classified as acute graft-versus-host disease (aGvHD) (group I, group II and group III according to the time before, during and after the onset of GvHD, respectively) and non-aGvHD. CD25+, CD69+, DR+, CD134+ and CD154+ CD4+ cell subpopulations were quantified and expressed as percentage of CD4+ lymphocytes. The bar represents the mean of the percentage values for each group. The mean ± standard deviation is indicated under each group of samples. Differences between each group and the respective non-GvHD group were evaluated using t-test and the P-value indicated in parenthesis. P < 0·05 is considered statistically significant.