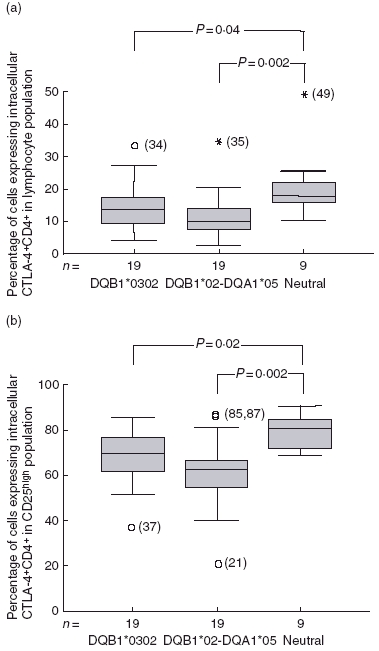
Fig. 2.

(a) Percentages of CD4+ lymphocytes co-expressing intracellular cytotoxic T lymphocyte-associated antigen 4 (CTLA-4) were decreased in DQB1*0302 (P = 0.04) and DQA1*05–DQB1*02 (P = 0.002) positive individuals, compared to the neutral genotype group. Plots represent the percentages of CD4+ lymphocytes co-expressing intracellular CTLA-4 where samples are grouped as DQB1*0302 (n = 4), DQA1*05–DQB1*02 (n = 19) or neutral (n = 19) carrying neither risk nor DQB1*0602 genotypes. Percentages are illustrated in centile box plot (10th, 25th, 50th, 75th and 90th centiles) and outliers (1.5–3 box lengths from the box) shown as circles and extremes (> 3 box lengths from the box) as stars. (b) Percentages of CD4+CD25high cells co-expressing intracellular CTLA-4 were decreased in DQB1*0302 (P = 0.022) and DQB1*02-DQA1*05 (P = 0.002) genotype individuals compared to neutral genotypes.
