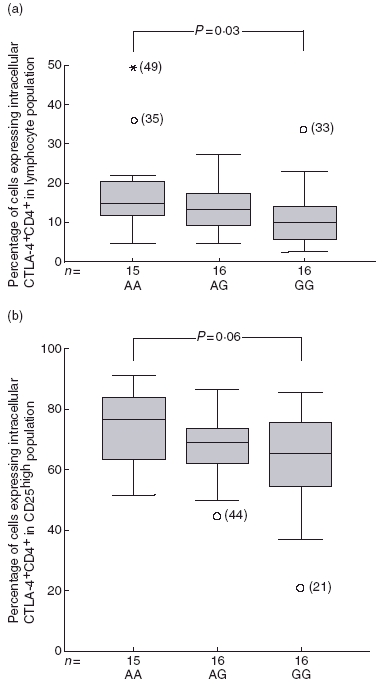
Fig. 3.

(a) Lower percentages of CD4+ lymphocytes co-expressing intracellular CTLA-4 was observed in the CTLA-4 +49GG genotype group compared to +49AA (P = 0.03). Percentages are illustrated in centile box plots (10th, 25th, 50th, 75th and 90th centiles and outliers). (b) Percentages of CD4+CD25high cells co-expressing intracellular CTLA-4 tended to be lower in +49GG genotype compared to AA genotype individuals (P = 0.06).
