
Figure 4.
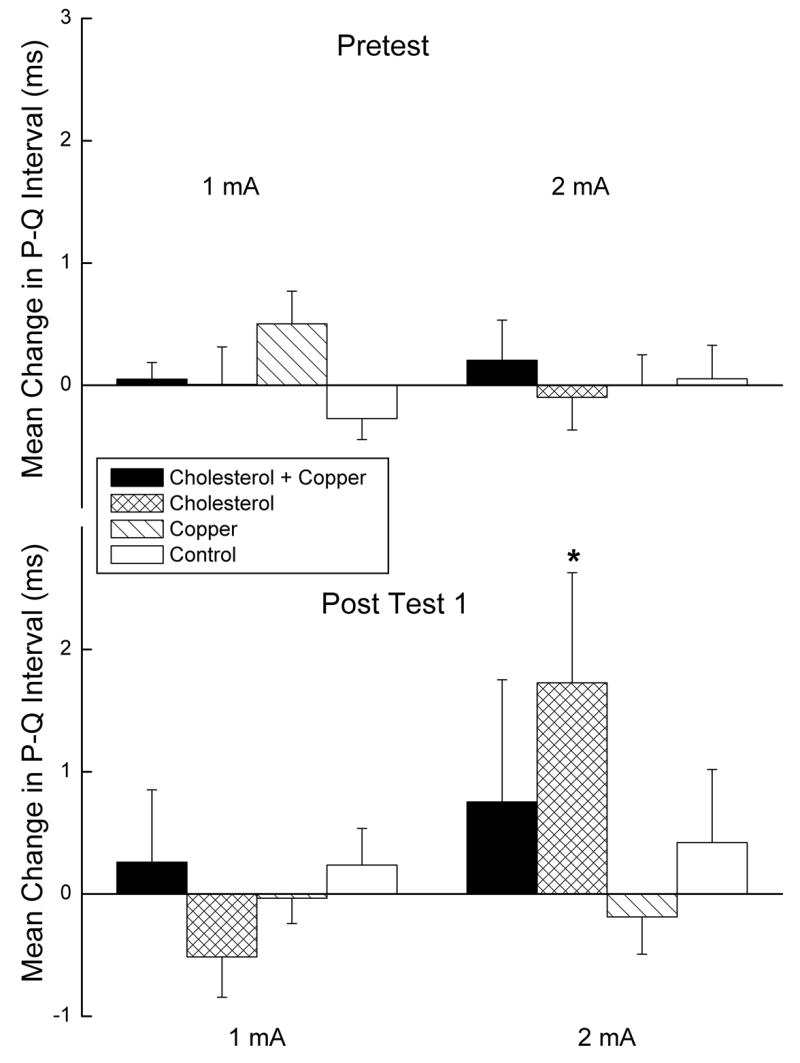
Mean change in PQ interval from the pres-stimulus baseline PQ interval following unconditioned stimulus (US) presentation for the first twenty trials of Pretest and Post Test 1 at the 1- and 2-mA US intensities collapsed across US duration for rabbits in the cholesterol + copper, cholesterol, copper and control groups. PQ intervals are derived from the PQRST waveforms in the electrocardiogram recorded from 2,000 ms before US-onset to 2,000 ms after US onset.